
One Thing Doesn't Change
63.5 is apparently the soul of baseball.

Day 91 Of The 2026 MLB Season
On June 24th, Braxton Ashcraft threw six innings, struck out 10, walked nobody, and allowed one run. He threw 86 pitches and the Pirates won 11-1. His pitch chart looks pretty normal on first glance
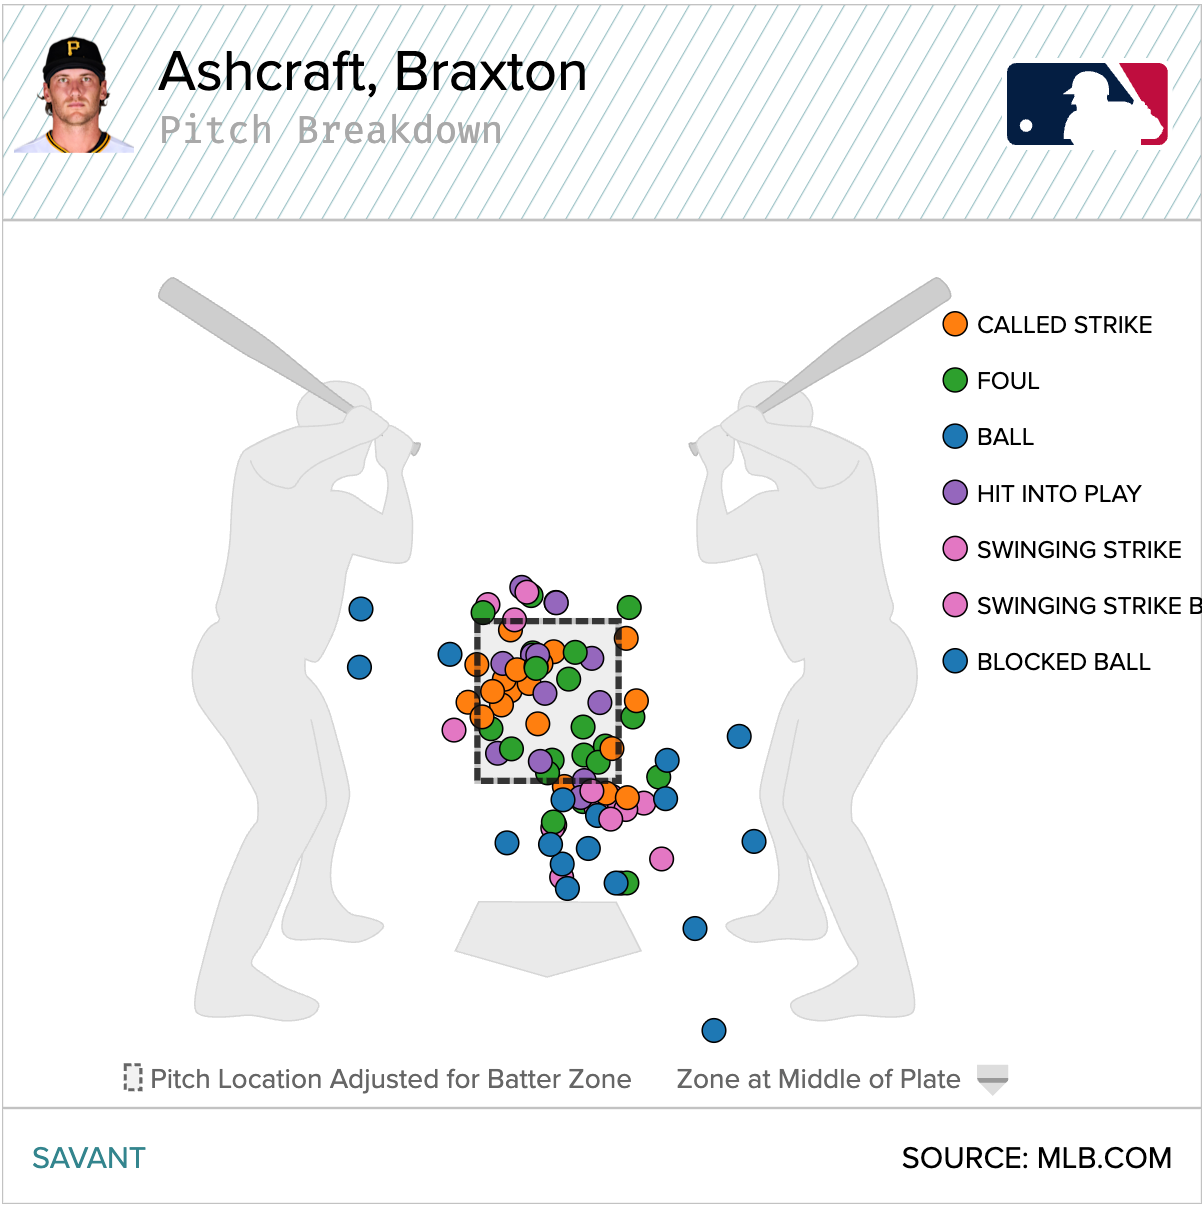
but it’s actually extraordinary. Let’s take a trip.
*_<
Baseball always looks noticeably different than it used to, and two forces explain most of its changes: Maximization and disruption.
Maximization is: Once a strategy is known to be good, players and teams sell out pursuing that strategy, generation building on generation. If a tactic is found to support the strategy, the tactic spreads. “Strike the other team out a lot” is one such strategy, and “throw harder,” “throw more secondary pitches that can get chase,” “get taller pitchers,” “teach extension,” “prioritize fastball rise instead of sink,” and “get catchers who can frame” are tactics in support. The league’s strikeout rate—and its fastball velocity, its rate of secondary pitches thrown, its catchers’ framing performances, its whiff rate, its batting average, even its rates of catcher’s interferences and pitchouts and triples and hit-by-pitches and complete games—are all pretty much unrecognizable compared to even a quarter-century ago, because “strike the other team out a lot” is a universal strategy. And thus baseball changes.
Disruption is: One thousand players playing tens of thousands of games against each other year after year will tend toward an equilibrium. When even a small change is forced into the system—by changes to equipment or environment, by rules changes, by expansion—the equilibrium wobbles and everybody runs around trying to find the new tactics to maximize. A tiny tweak to the seams of the ball in mid-2015 increased home runs by—at juiced-ball peak—60 percent, which led to hitters changing their swings to take advantage, which led to pitchers altering their repertoires to counter these swing changes, which led to the league’s rules committee deciding baseball had gotten too static and needed more stolen bases. And then a decades-long decline in stolen bases (maximization) was entirely undone by one tweak to the rules (disruption), which probably led to innovations in sliding (maximization), etc and so on, and thus baseball changes.
There’s a third force, as well. It’s also very powerful, but it mostly holds baseball together, limits change. We can call that force “63.5.” That’s roughly the rate of pitches that are strikes, leaguewide. And for some reason, despite all the changes catalogued above, and dozens of other changes that I could name—universal DH, the rise and the banning of the infield shift, the spread and the banning of performance-enhancing drugs, sabermetrics, two expansions and then a long expansion drought, Coors Field, Statcast, the decline of small ball, ABS—that number barely moves.
In 2001, the league’s strike rate—either called strikes, or balls swung at—was 63.0 percent. This year, the league’s strike rate is 63.7 percent. In the 24 seasons in between, the league’s strike rate has never strayed far from 63.5, never a full percentage point higher or lower.
Since 1988, in fact, the strike rate has only really changed once. That happened when MLB introduced the QuesTec system in 2001 to monitor and standardize umpiring, causing the biggest jump in called-strike rates in history, a very big disruption. Before QuesTec the average strike rate was only 61.8 percent. But it was just as steady before QuesTec as it has been since QuesTec. In the 11 years that preceded QuesTec, the league’s strike rate never moved more than 0.4 percentage points in either direction.
So the strike rate can change, but it is extremely resistant to it.
*_<
There’s a lot about this that’s interesting to me.
ONE
is that this number, this sturdy, unchanging, unresponsive number, is so complex that it seems like it could/should be really volatile. When a pitch fails to be a strike, it could be that the pitcher couldn’t throw one (skill), or that he didn’t really want to throw one (tactics), and/or that the batter didn’t swing at a pitch that the pitcher wanted him to chase (cost of living in a society).
You might predict that these three variables would produce a strike rate that’s in complete, haphazard flux, unpredictable and equilibrium-defying, baseball’s three-body problem. In mid-2015, for example, the league started playing with a much livelier ball. Homer-hitting went crazy. We might assume that Variable 1 (pitcher skill) would stay the same, but hypothesize that Variable 2 (pitcher tactics) would change dramatically in response. Pitchers would be scared to go in the zone, since balls in play had become much more damaging. They would nibble, their strike rate would go down, batters would be ahead in the count more, which would enable them to make better decisions and hit the ball even harder, which would cause pitchers to be even more scared, the whole thing would spiral, the planet would get sucked into one of the suns. What actually happened to the strike rate is: Nothing. It stayed basically the same, as it always does.
That’s just one example. You could spin off a thousand scenarios where one might hypothesize that the strike rate could veer wildly. But it never happens. The leaguewide strike rate at Coors Field, the worst place in the world to pitch? You guessed it. Somehow, in the 19 years I have data for, it’s 63.5 percent.
TWO
is that strike rate somehow hasn’t succumbed to the forces of maximization.
